WWF-Canada’s Living Planet Data Hub is live, now it’s your turn
Environmental data takes many forms — from high-resolution satellite imagery to local biodiversity surveys to find out which organisms live where — and can be invaluable to community and governmental decision makers, local land managers and environmental technicians.
But just because data is available doesn’t mean it’s accessible. Often, it’s locked behind academic paywalls or tucked away on technical websites, making it hard for people leading on-the-ground conservation work to make use of it.
We believe data can be a catalyst for conservation action, but only if it can be found.
Enter the Living Planet Data Hub.
Turning uncertainty into insight
The hub brings key environmental data together in one place for anyone who wants to use WWF-Canada’s national-scale analyses to inform their own decision-making and action plans. The analyses include work to determine which regions in Canada have high ecosystem carbon stocks or are important for protection. That way, they can reduce time spent searching for relevant information and focus instead on applying it to their project plans.
What the Data Hub does
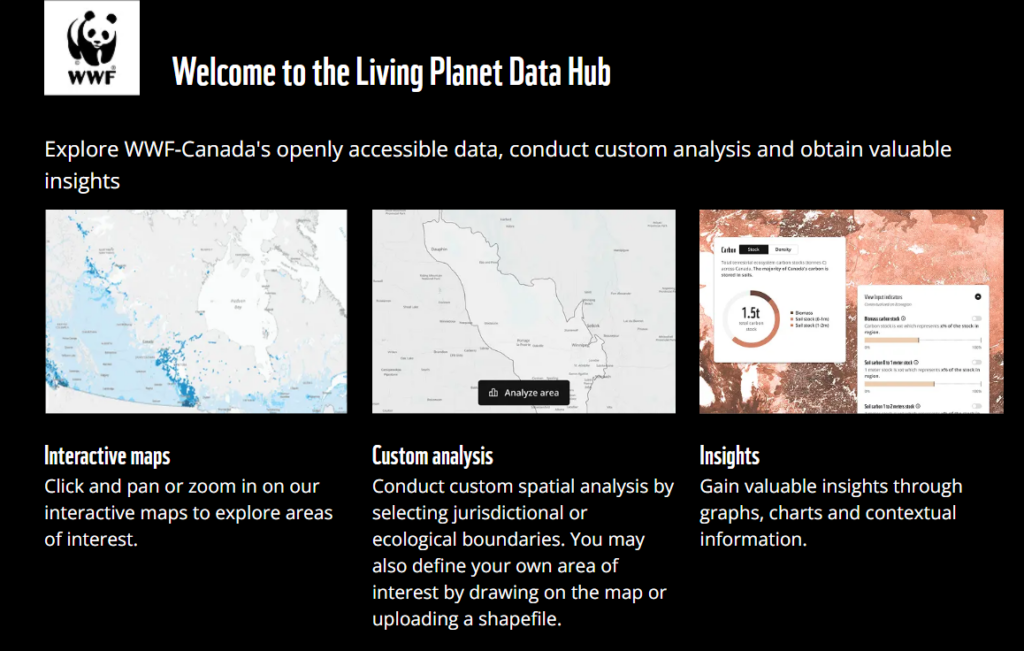
The Hub features three core functions: an interactive map, data analysis and custom report building.
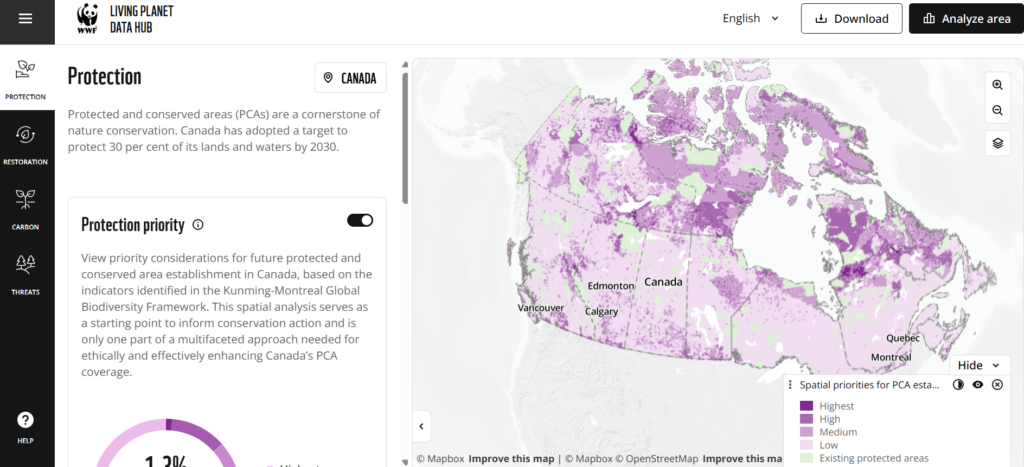
Interactive map: Enables visualization of multiple layers — such as where restoration is likely to be successful most likely to benefit biodiversity — across four conservation themes: protection, restoration, carbon and threats.
Data analysis: Provides insights through graphs and charts.
Custom reports: Supports strategic planning by generating PDF reports specific to the conservation theme and area of interest.
Peer-reviewed data you can trust
Action is only as good as the data behind it. The Hub uses WWF-Canada’s open-source, national-scale datasets that have been organized into four broad conservation themes and presents them on the interactive map:
Protection: This theme shows existing protected areas along with priority areas for future protection. Priority areas have been determined through five indicators related to connecting landscapes and protecting biodiversity, for example how protected areas are connected to each other.
Restoration: This theme shows an overview of converted lands alongside priority areas for restoration. Prioritization is based on benefits to biodiversity and carbon storage potential.
Carbon: This view shows carbon stock and density (for total ecosystem carbon) using data from our National Carbon Map. Additional layers specific to biomass carbon and soil carbon up to a depth of one metre are also included.
Threats: This theme showcases areas where threats overlap across the country and combines up to 15 high-intensity treats to terrestrial ecosystems including urban areas, human population density and roads.
The Hub also helps advance Regenerate Canada — our 10-year plan to expand habitat, reduce atmospheric carbon and lower impacts from industry — by sharing data that can support community-led efforts to reverse wildlife loss and fight climate change.
Experience the Living Planet Data Hub
Ready to see how it can be used by your community or class? Watch the how-to video guide below or dive right in and start building your first custom report here.