Conservation with co-benefits: How carbon mapping makes biodiversity decisions more impactful
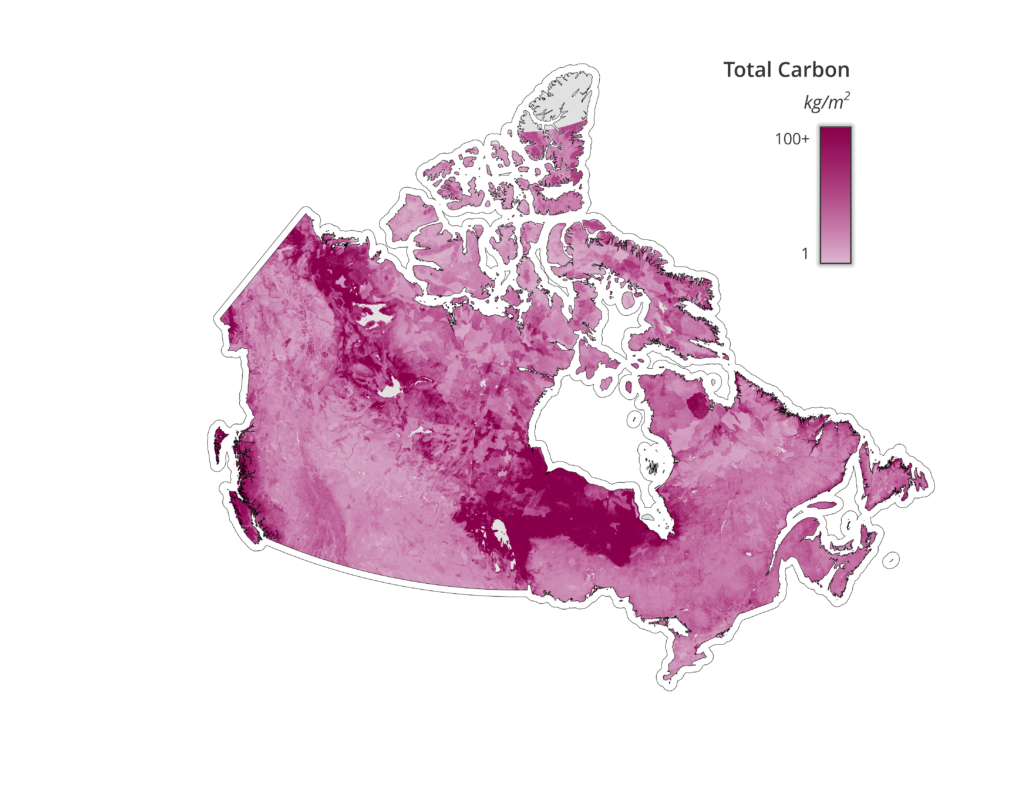
Our recent national carbon map revealed that 327 billion tonnes of carbon are currently stored in plants and, predominantly, the first metre of soil across Canada.
Now that we know where the carbon is, we can amplify our efforts to fight climate change and biodiversity loss at the same time — starting in New Brunswick.
Last year, we put out a priority threat management study identifying which conservation actions would have the most benefit for wildlife in the Wolastoq/Saint John River watershed. We can now further prioritize these actions by using the carbon map dataset (v.2) to quantify the carbon benefits of these conservation actions.
The most beneficial action to reduce wildlife loss and mitigate climate change would be to protect an additional 3,542 square kilometres in the Wolastoq watershed. (This would bring the watershed’s terrestrial and freshwater protected areas from three to 17 per cent to more closely match 2020 federal targets.)
Our follow-up study found this conservation action would have the co-benefit of preventing the equivalent of 6.1 million tonnes of carbon dioxide from being released, which is about half of the province’s total greenhouse gas emissions in 2019.
Doing the math
We calculated this by averaging carbon densities for unprotected areas in the Wolastoq using the carbon map. This showed how protecting a given amount of wildlife habitat can help an associated amount of carbon stay in the ground rather than being released when humans disrupt a natural ecosystem through actions like cutting down trees or developing infrastructure.
But to ensure this estimate was accurate, we also took into account that not all of this area is at risk of being disturbed. To calculate how much carbon is actually at risk of entering the atmosphere, we looked at the rate at which land in the area has been converted for other uses — drained, deforested, dug up, etc. — over the last 30 years.
Applying this to the total amount of stored carbon, we determined how much is vulnerable to being released by 2050 if these habitats are not adequately protected.
And the math doesn’t stop here. Our carbon map can serve as a baseline for calculations like this across the country as other researchers, community members and partners start using this data to determine the carbon co-benefits of protecting terrestrial areas in their regions.
We’re running out of time to reverse the path we’re on, so it’s crucial to make all of our conservation efforts as impactful as possible by addressing both the climate and biodiversity crises.